
Skip to text alternative of the following infographic
Infographic Transcript
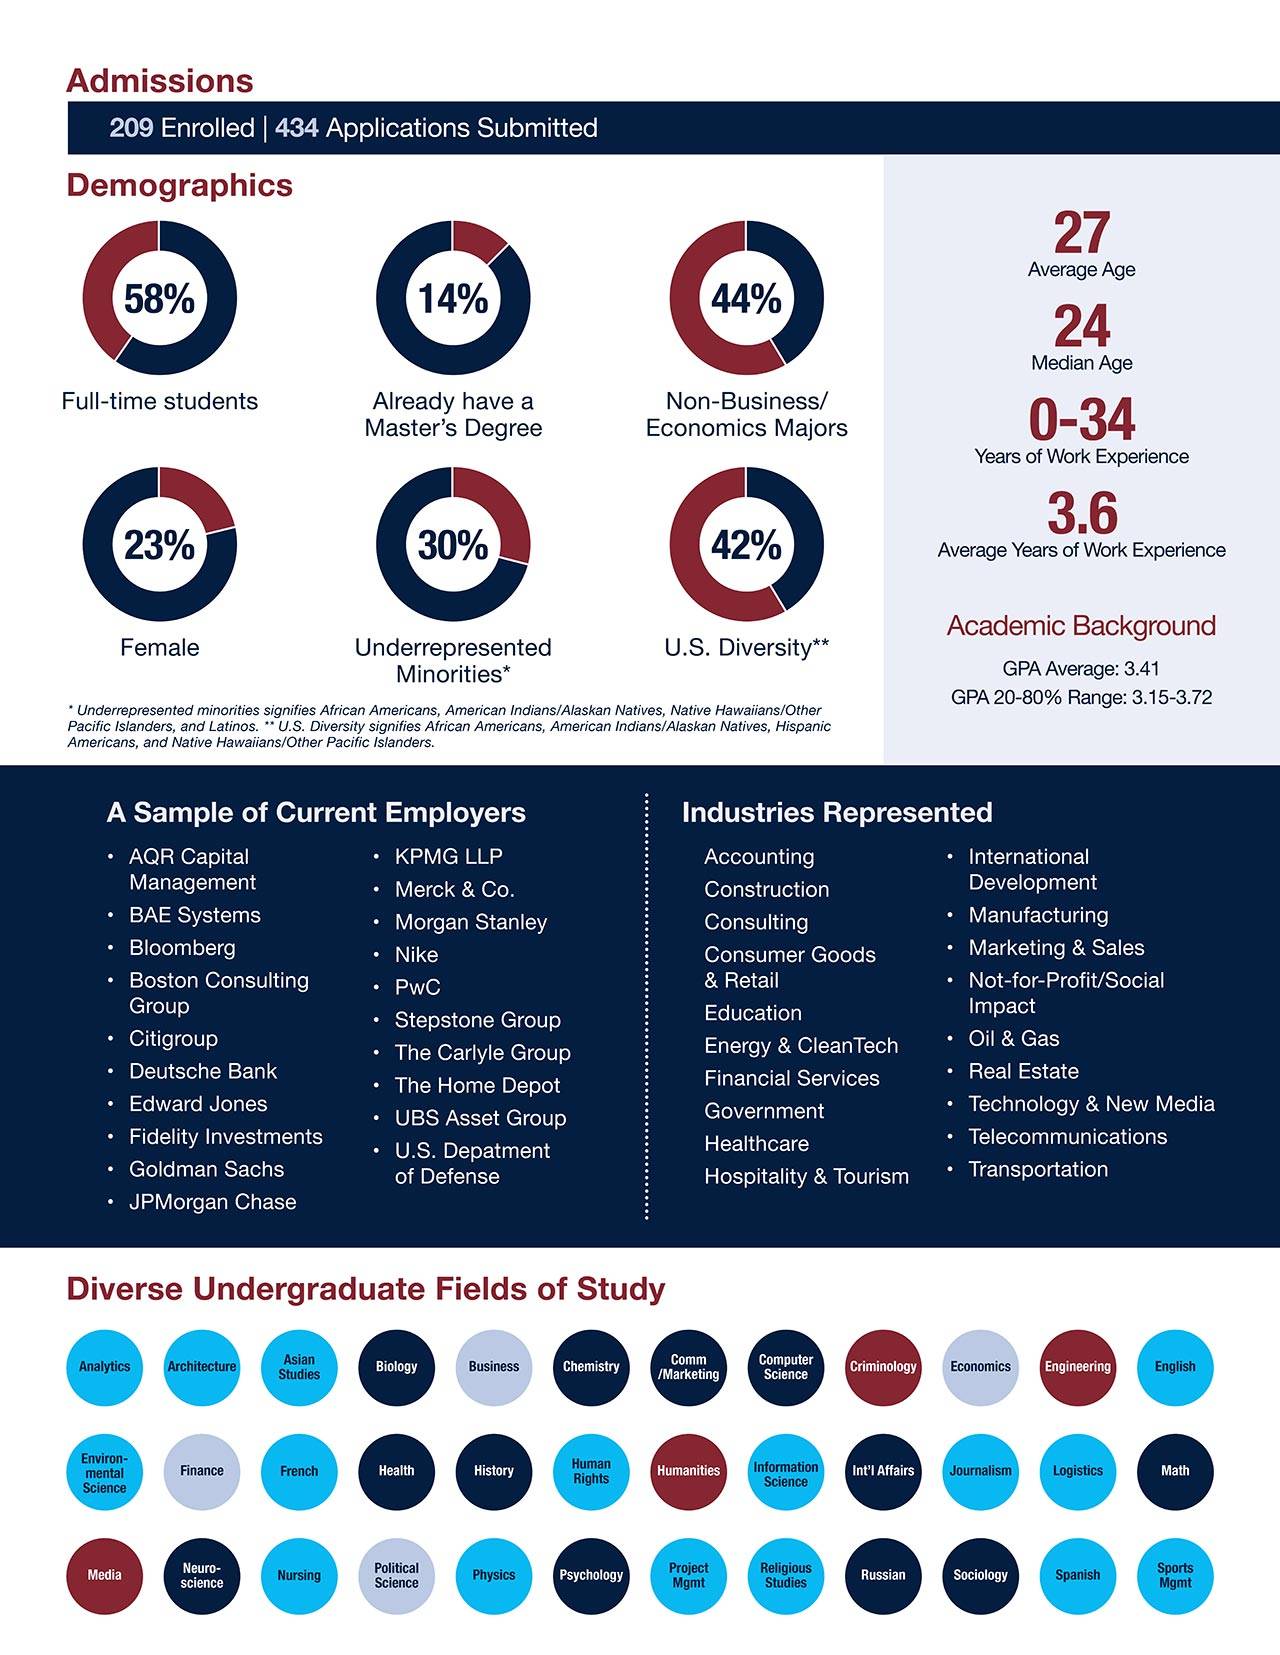
Georgetown MSF Incoming Class Profile The infographic appears on a white background with dark navy and red accent colors, organized into four sections. The Georgetown University McDonough School of Business branding appears throughout. Admissions The following appears in a section with a red heading and a dark navy banner beneath it: 209 Enrolled | 434 Applications Submitted Demographics The following appears in a section with a red heading, organized into two columns — pie charts on the left and statistics on the right. Six dark navy and red pie charts display the following percentages, each accompanied by a label beneath: 58% Full-time students 14% Already have a Master's Degree 44% Non-Business/Economics Majors 23% Female 30% Underrepresented Minorities* 42% U.S. Diversity** * Underrepresented minorities signifies African Americans, American Indians/Alaskan Natives, Native Hawaiians/Other Pacific Islanders, and Latinos. ** U.S. Diversity signifies African Americans, American Indians/Alaskan Natives, Hispanic Americans, and Native Hawaiians/Other Pacific Islanders. To the right of the pie charts, the following statistics appear in large bold navy type: 27 — Average Age 24 — Median Age 0–34 — Years of Work Experience 3.6 — Average Years of Work Experience Academic Background The following appears in a section with a red heading, directly below the pie charts: GPA Average: 3.41 GPA 20–80% Range: 3.15–3.72 A Sample of Current Employers The following appears on a dark navy background with a light blue heading, organized into two side-by-side columns of bulleted lists: AQR Capital Management BAE Systems Bloomberg Boston Consulting Group Citigroup Deutsche Bank Edward Jones Fidelity Investments Goldman Sachs JPMorgan Chase KPMG LLP Merck & Co. Morgan Stanley Nike PwC Stepstone Group The Carlyle Group The Home Depot UBS Asset Group U.S. Department of Defense Industries Represented The following industries appear in a bulleted list alongside the employer list, on the same dark navy background: Accounting Construction Consulting Consumer Goods & Retail Education Energy & CleanTech Financial Services Government Healthcare Hospitality & Tourism International Development Manufacturing Marketing & Sales Not-for-Profit/Social Impact Oil & Gas Real Estate Technology & New Media Telecommunications Transportation Diverse Undergraduate Fields of Study The following appears in a section with a red heading on a white background. Undergraduate fields of study are displayed as individual colored circle buttons — alternating in dark navy, medium blue, and light blue — arranged across three rows: Analytics · Architecture · Asian Studies · Biology · Business · Chemistry · Communications/Marketing · Computer Science · Criminology · Economics · Engineering · English · Environmental Science · Finance · French · Health · History · Human Rights · Humanities · Information Science · Int'l Affairs · Journalism · Logistics · Math · Media · Neuroscience · Nursing · Political Science · Physics · Psychology · Project Management · Religious Studies · Russian · Sociology · Spanish · Sports Management